Food Search Word Wars: Battle of the Baked

Why Even Write This?
Back in the 90’s many of
you would have observed the rise of the rotisserie chicken stall? Depending on
where you live, within 10 minutes’ drive from where you are is an Andok’s,
Baliwag or some other chicken roaster. What about milk tea? Zagu ring a bell?
It’s probably the ancestor of the milk tea craze in the PH? The point here is
that, historically, some food reaches peak levels of popularity and then adoption
as part of the accepted staples.
I’ve always been fascinated with food and how food culture evolves as a function of time and the environment. The internet allows the proliferation of these to spread at exponential speeds. I want to make a series of posts looking into popular food here in the Philippines while trying to apply some science in understanding how popular they are.
The Contest
Facts out. I’m not a data
scientist nor am I a rockstar online advertising expert. I’m just a food nerd
and I want to know how popular some of the food trends I see online are in the
country. The metric I’ll be using for simplicity are the metrics found in
Google Trends. In particular, I would
look at the data from January 1, 2020 to August 17, 2020 to compare the
interest over time and the interest per region to gain an appreciation of the food
items I chose to research.
The Contenders
As the old adage goes, “A
picture speaks a thousand words”. These products need little introduction but
we still want our food porn so we scoured online for what we think are the most
craving-inducing candidates we can find. We leave the pretty pictures of the
product contenders to introduce themselves.
Note: We do not own any of
the photos provided here. We posted these as homage to the product category
they belong to and as a compliment to those who made these exquisite products.
They do their category proud and they are credited in the captions below the
photos. We do not receive anything from the makers of these products. We just
think they make great examples of what the product could be.
Ube Cheese Pandesal

“Busog na busog’! The Ube Cheese Pandesal offered by panaderya.ph is bursting with its thick filling of ube halaya and generous slices of cheese.
Sushi Bake

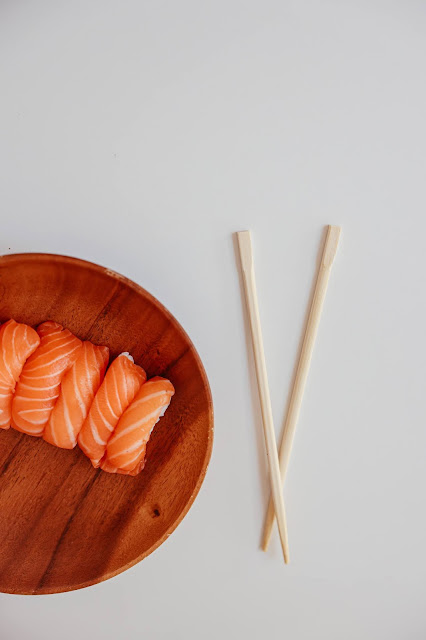
This beauty came from the Instagram page of The Sushi Bake (@thesushibake). As I stared into the glorious layers of baked goodness, I had to remind myself that I already ate.
Yema Cake

We heard praises for the
Rodilla’s Yema Cake. We saw this wonderful dessert in all its glory through the
awesome blog post here.
How to read the data
Interest over time
Interest by subregion
Related topics
Related queries
Tale of the Tape
Let’s now see how the following baked goods match up to one another according to the data researched.
Interest Over Time

This is a screenshot of the
graphs for the three products. We note the following:
- Ube Cheese Pandesal peaked after March while Sushi Bake and Yema Cake peaked near June.
- All products showed a trend towards increasing interest from January until they reached their peaks.
- This is inconclusive but given the data available, it seems the products are tapering off from their highest levels. This can change however so we cannot conclude what will really happen in the future.
Interest by Region
For Ube Cheese Pandesal

It’s interesting to see a
geographic representation of how interested a region is to a certain food
product, as seen for Ube Cheese Pandesal in the graph above. At the right are
also the relevant search terms being used related to the product. Notice how
the top related queries are based on consumption behavior: questions on price,
questions on the nearest provider and questions on the caloric load.
For Sushi Bake

In terms of relative interest per region, it appears here that for sushi bake, it is more intense in areas near the south of NCR. At the right are also the relevant search terms being used related to the product. Notice how the top one and three related queries are based on producing the item: questions on recipes and questions on baking.
For Yema Cake

Of the three products, Yema
Cake is the one with intense interest in northern Luzon. It’s also the only one
among the three with interest generated in Palawan. At the right are also the
relevant search terms being used related to the product. Notice how the top three
related queries are based on producing the item, questions on baking
procedures, ingredients and recipe.
Compared Breakdown by Subregion

For Ube Cheese Pandesal
Based on the data above,
among all the performances per region, Ube Cheese Pandesal seems to have the
most intense interest in Northern Mindanao. In Metro Manila, it comes in second
relative to Sushi Bake. It has the least intensity of interest in MIMAROPA.
For Sushi Bake
Based on the data above,
among all the performances per region, Sushi Bake appears to have the strongest
interest in Metro Manila with Davao coming close. Similar to Ube Cheese
Pandesal, it has the least intensity of interest in MIMAROPA.
For Yema Cake
Based on the data above,
among all the performances per region, Yema Cake appears to have the strongest
and even dominant interest in MIMAROPA. It’s the third in Metro Manila but it
has strong interest in areas further away from Metro Manila like Western
Visayas, Cagayan Valley and Region XII.
Conclusion
As I mull over the
information, I realize how useful this tool can be for a food entrepreneur
planning or currently providing the products to have a greater understanding of
the Philippine market. There is no single food item that dominates all the regions. For me however, my key takeaway here is that the
original reason why I am fascinated by food culture still holds. Food culture
evolves as a function of time and the environment. The internet allows the
spread of these food cultures but each area reacts differently.
Thank you for reaching this
far! I hope it’s been helpful to you. Writing this increased my appreciation
for the food itself and also increased my desire to continue looking into
interesting topics related to food. If you think this information is helpful to people you know please do feel free to share! If you want us to do a similar dive into
other food products or look into other topics then please do
send us a message on our Facebook page.

Comments
Post a Comment